Monday, March 16, 2015
Learning Goal: We will be able to solve all problems related to the learning objectives mastered to date.
Today's Announcements:
- Voluntary lunch tutoring is available Monday-Thursday on all days that I am here. Please take full advantage of this opportunity as it is a privilege and an extra resource.
- Tutoring is tomorrow from 3:45-4:45pm, the following students have mandatory Tuesday tutoring. Please make sure you let your parents know head of time so that they can make transportation arrangements. A tutoring bus will be available. Any student who does not report to mandatory tutoring will have to make up day the following Friday from 3:45-5:30pm.
- You will be in Assembly Bell Schedule tomorrow due to academic awards celebration.
- YOUR MATH STAAR TEST WILL BE APRIL 21, 2015.
- 23 instructional days until your math STAAR!
Homework Helpers
- Andrew Blanco
- Victor Vasquez
- Abril Vigil
Problem of the Day: A jar contains 75 jelly beans: 15 red, 20 blue, 30 green, and 10 black. What is the percentage of the number of jelly beans that are not black?
Hint: Turn the fraction into a decimal, then turn that decimal into percent!
Hint: Turn the fraction into a decimal, then turn that decimal into percent!

Classwork:
Activity 1: We will be analyzing our own individual Mock STAAR results. We will do this in groups of 4.
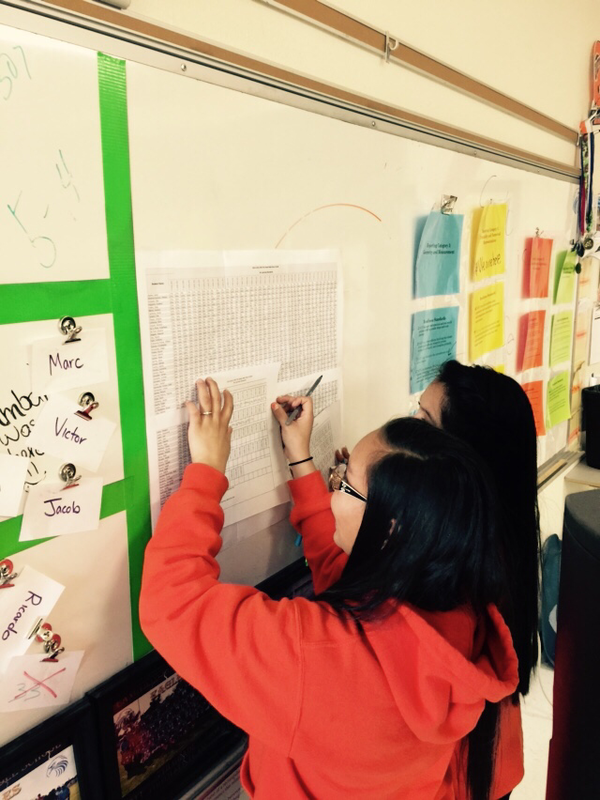
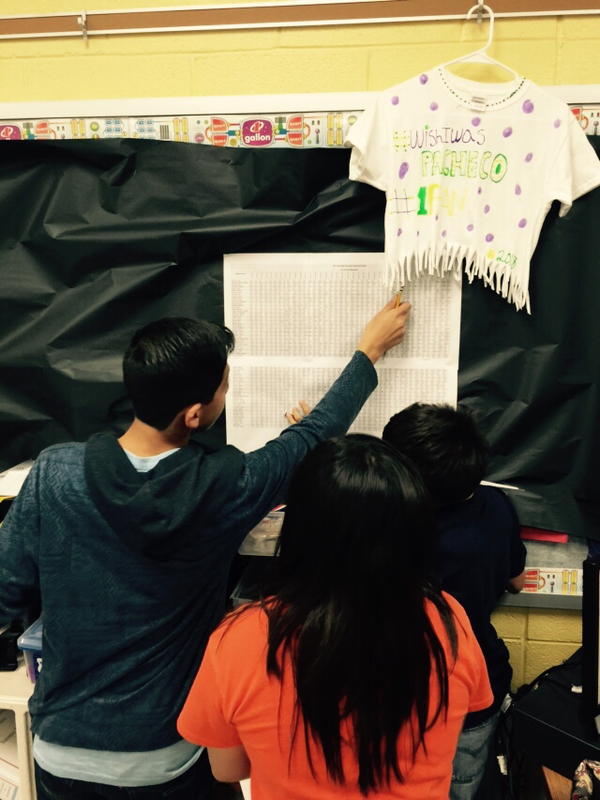
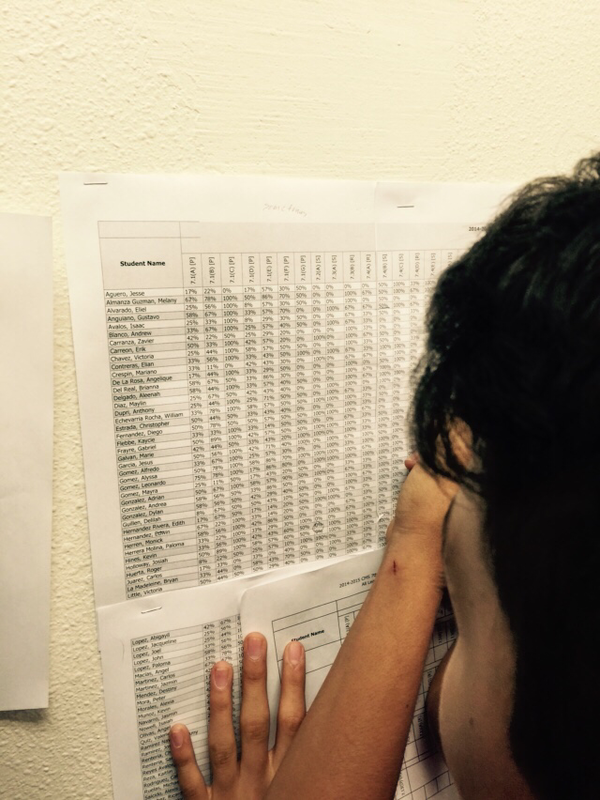
| mock_staar_data_2015_student_data_sheet1.pdf |
Homework:
pg. 212 problems 1-9
Tuesday, March 17, 2015
Learning Goal: We will be able to solve all problems related to the learning objectives mastered to date.
Learning Goal (7.6F): We will be able to use the data from a random sample to make inferences about a population
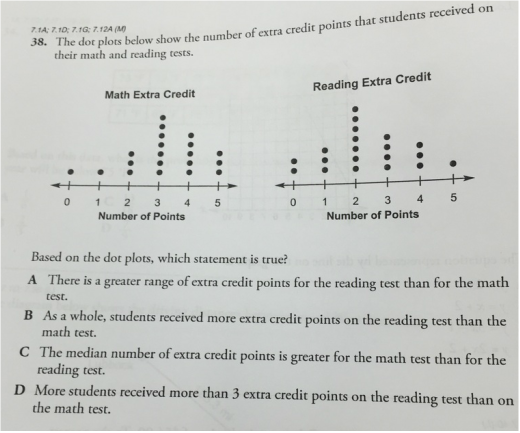
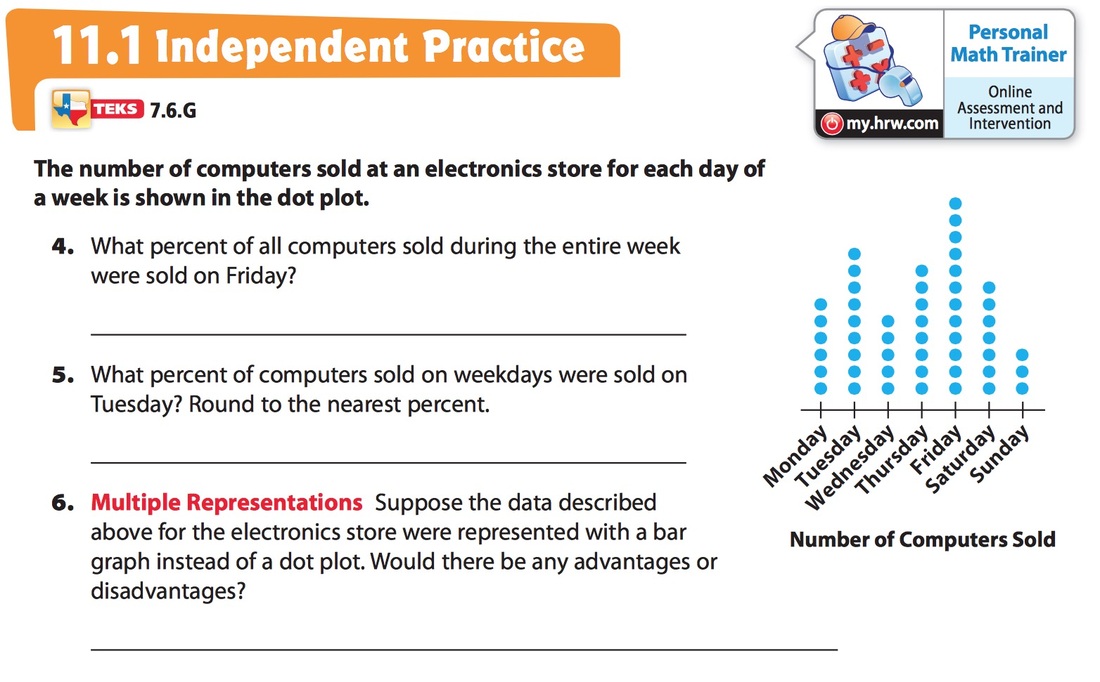
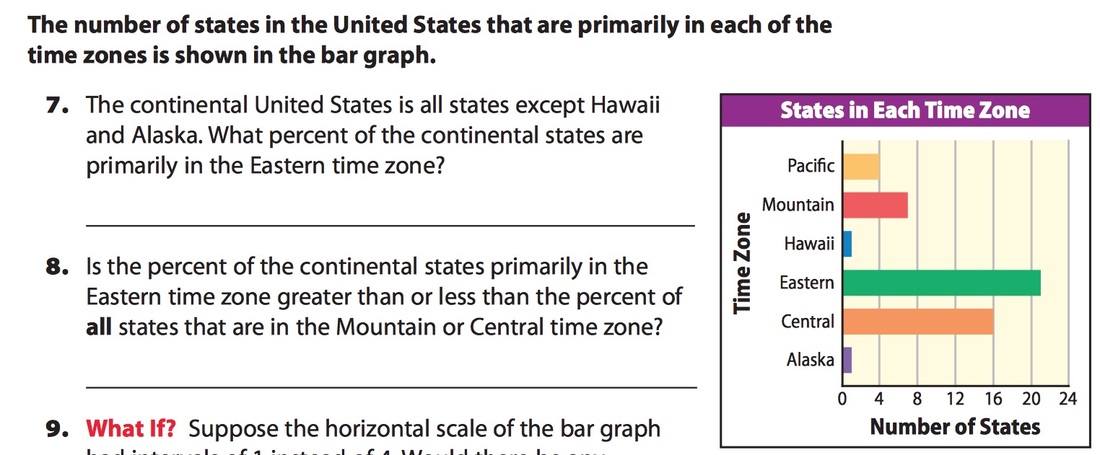
Learning Goal (7.6G): We will be able to solve problems using data represented in bar graphs, dot plots, and circle graphs, including part-to-whole and part-to-part comparisons and equivalents
Learning Goal (7.12A): We will be able to compare two groups of numeric data using comparative dot plots or box plots by comparing their shapes, centers, and spreads
|
Today's Announcements:
Homework Helpers
|
|
Problem of the Day: What is the lateral surface area of a triangular pyramid, in which the base is an equilateral triangle with sides 10 inches long and with lateral faces that have a slant height of 16 inches?
|

|
Classwork:
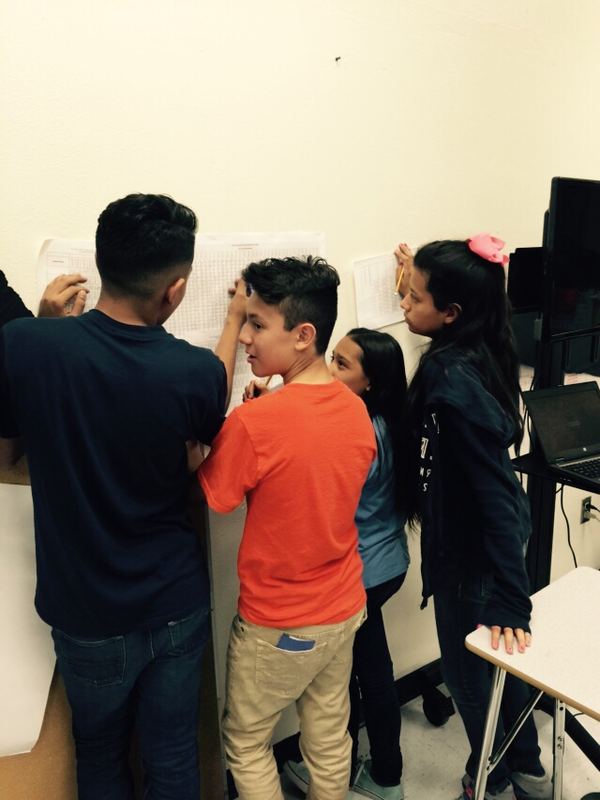
Activity 1: We will be desagragating our own individual Mock STAAR results. We will do this in groups of 4.
Activity 2: We will record 8 Mock STAAR videos based on the questions our classmates missed the most.
Activity 2: We will record 8 Mock STAAR videos based on the questions our classmates missed the most.
Todays presenters:
- Monick Herren
- Andrea Gonzalez
- Elian Contreras
- Delilah Guillen
- Victoria Little
- Abigayil Lopez
- Eliel Alvarado
- Peter Mora
- Brian LeMadeliene
- Paloma Lopez
- Melany Almanza
|
|

|
|
|
|
|
|
|
|
|
|
|
|
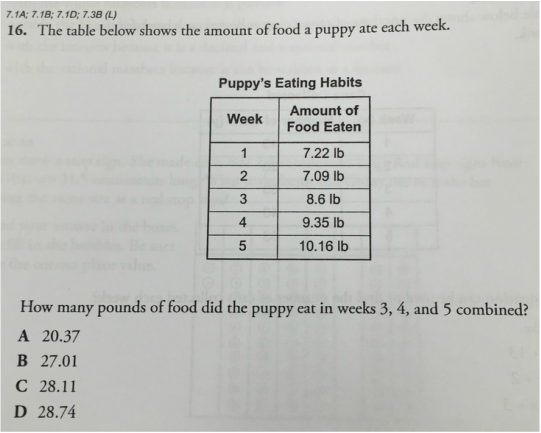
Here is the grader that will determine your score. The red counts as number of questions missed. We will grade this assignment this Thursday. We will be grading problems 1-10.


Homework:
|

|
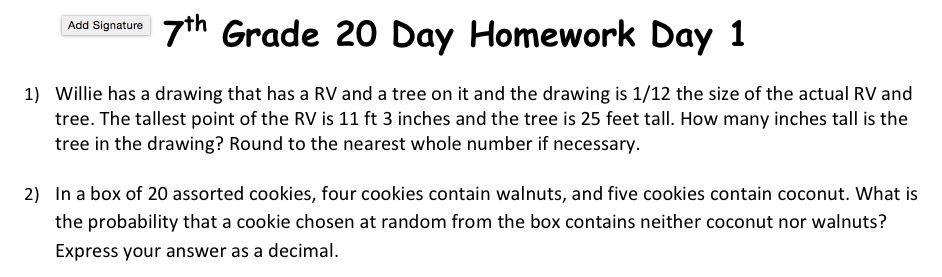
Homework Day 1 of 20 problems 1-10
Wednesday, March 18, 2015
Learning Goal: We will be able to solve all problems related to the learning objectives mastered to date.
Learning Goal (7.6F): We will be able to use the data from a random sample to make inferences about a population
Learning Goal (7.6G): We will be able to solve problems using data represented in bar graphs, dot plots, and circle graphs, including part-to-whole and part-to-part comparisons and equivalents
Learning Goal (7.12A): We will be able to compare two groups of numeric data using comparative dot plots or box plots by comparing their shapes, centers, and spreads
Today's Announcements:
- Voluntary lunch tutoring is available Monday-Thursday on all days that I am here. Please take full advantage of this opportunity as it is a privilege and an extra resource.
- Please make sure you are taking out the following materials at the beginning of every class: Mock STAAR booklet, data desegregation sheet, ISN, pencil, math textbook.
- YOUR MATH STAAR TEST WILL BE APRIL 21, 2015.
- 21 instructional days until your math STAAR!
Classwork:
Todays presenters:
- William Echeverria
- Hunter Huerta
- Alexis Salcido
- Andrew Blanco
- Isaiah Nowell
- Victor Vasquez
- Elizabeth Solivan
- Ms. Acosta
- Alyssa Gomez
- Maylin Diaz
- Leonardo Gomez
- Joel Lopez
- Aleenah Delgado
- Jaqueline Lopez
- Andrea Gonzalez
- Monick Herren
- Carlos Juarez
|
|
|
|
|
|
|
|
|
|
|
|
Ms. Acosta special edition!
|
|
|
|
|
|

|
|
|
|
Spanish Introduction!
|
|
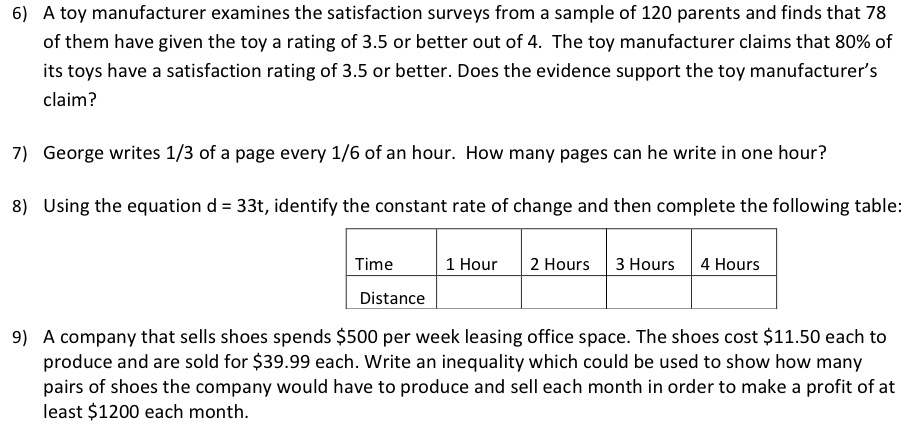
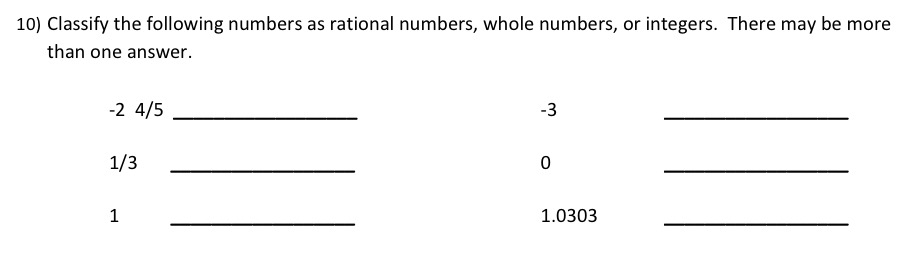
Activity 2: Please complete the following problems.
Here is the grader that will determine your score. The red counts as number of questions missed. We will grade this assignment this Thursday. We will be grading problems 1-10.
|
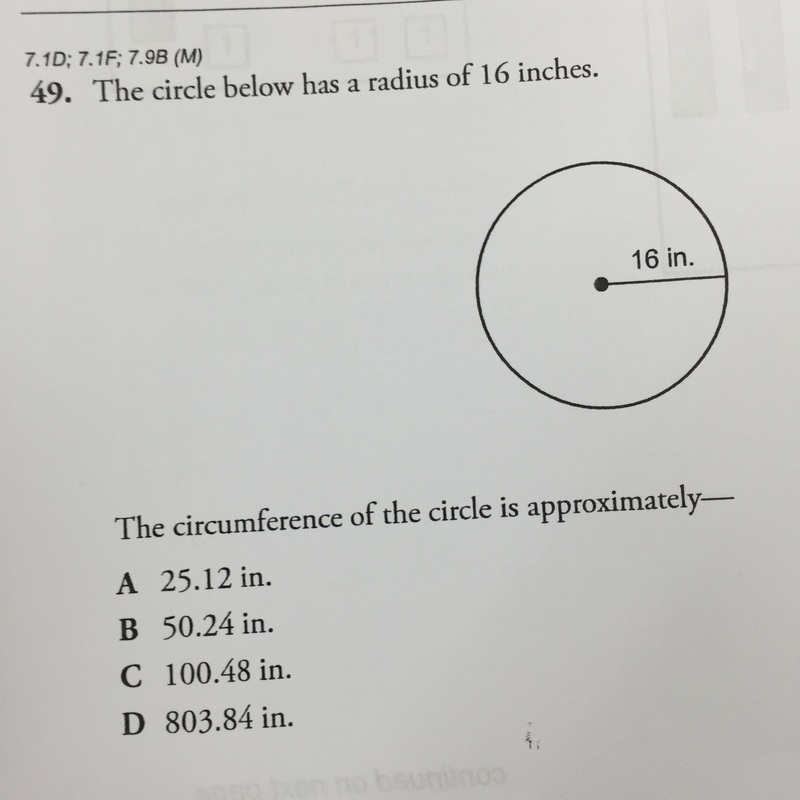
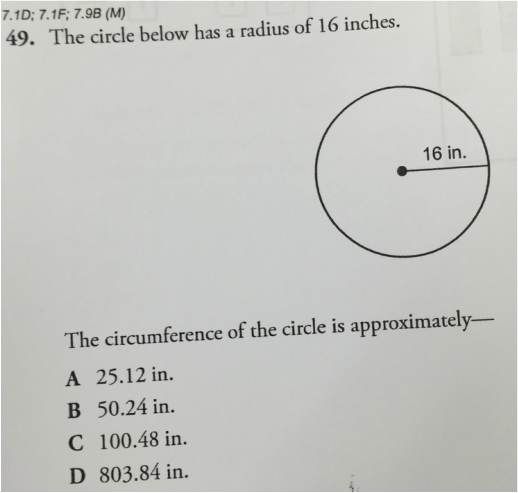
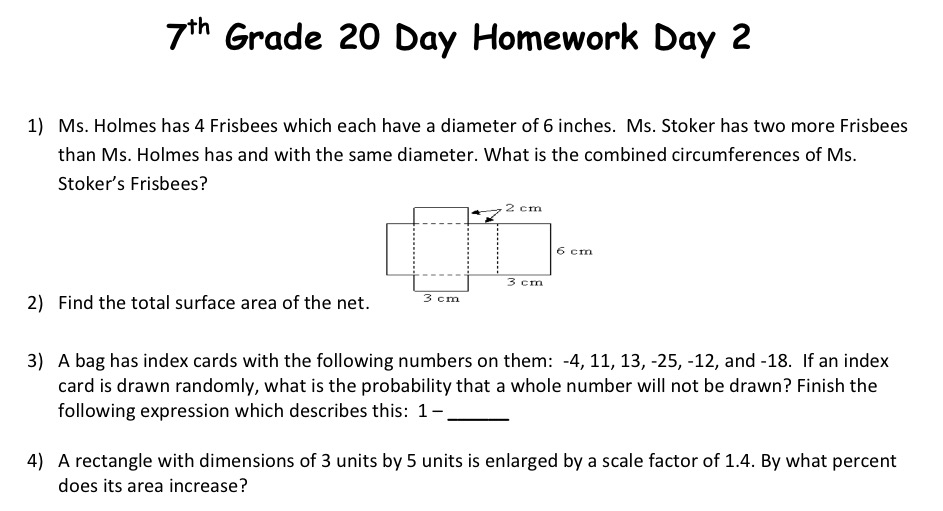
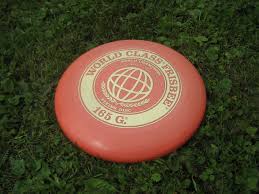
This is what a frisbee looks like for those that dont know! So problem number 1 is asking for the circumference of 4 of these combined.
|
Homework:
|
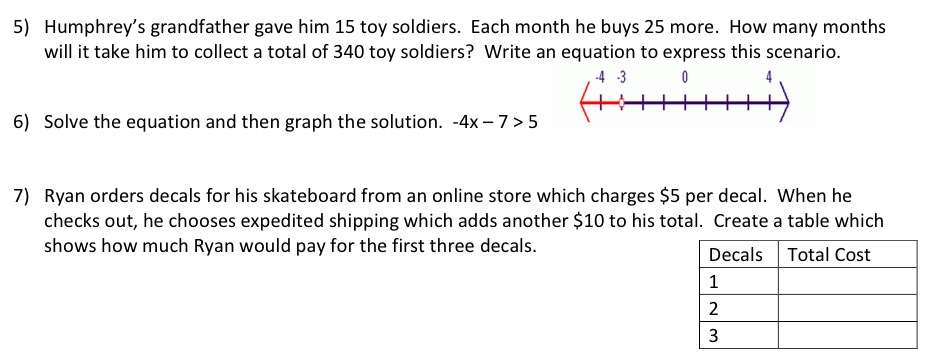
Homework Day 2 of 20 problems 1-10
|
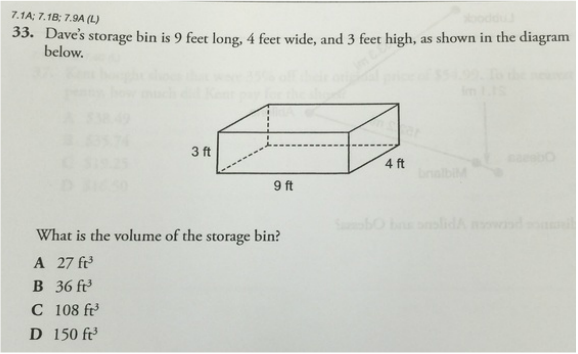
These are toy soldiers, some of you may have never had the opportunity with these since they are like way older than you!

|
Thursday, March 19, 2015
Learning Goal (7.6G): We will be able to solve problems using data represented in bar graphs, dot plots, and circle graphs, including part-to-whole and part-to-part comparisons and equivalents
Learning Goal (7.12A): We will be able to compare two groups of numeric data using comparative dot plots or box plots by comparing their shapes, centers, and spreads
|
Today's Announcements:
|

|
Todays presenters:
- Peter Mora
- Mr. Cruz
- William Echeverria
Problems of the day: Please copy these notes down as your daily notes.
|
|
|
|
Classwork:
Activity 1: Please take the notes that are covered in this video and write them in your ISN. This will serve as a review to transition into talking about statistical data.
Activity 2: You will look at atlas two pre-recorded videos from your classmates and write down the notes from two questions you and your group missed. Please copy these notes down in your Mock STAAR.
|
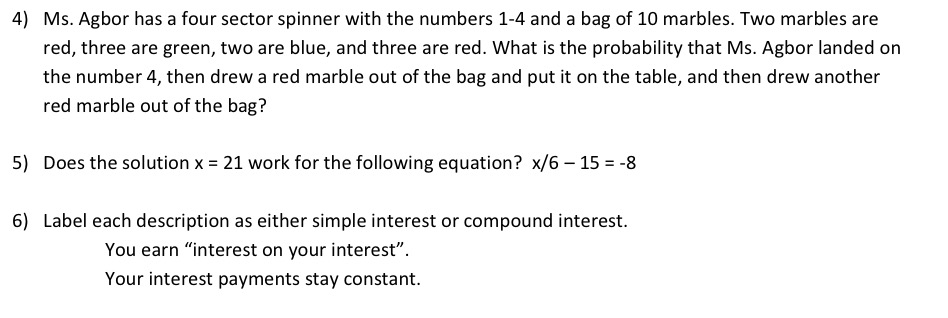
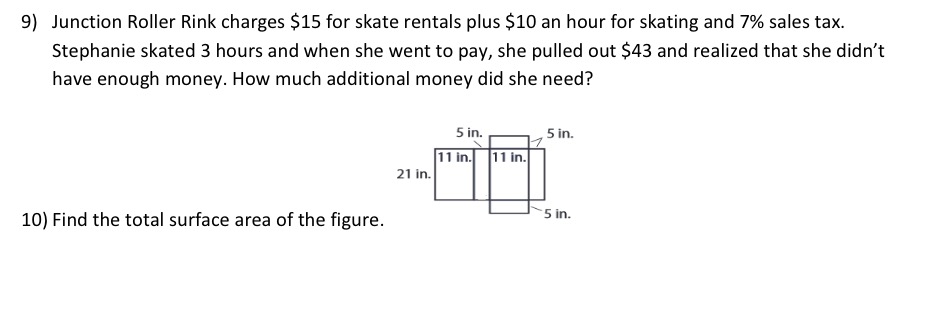
Activity 3: Please complete the following problems.
|
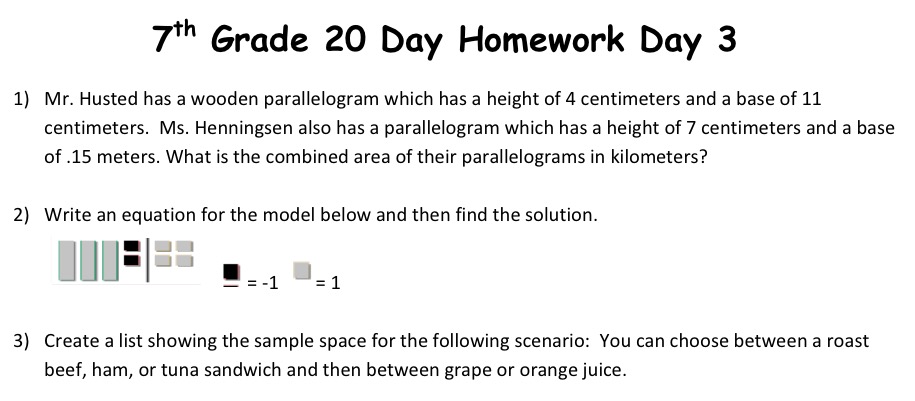
Interesting fact about parallelograms is the reason why their area is Length x Width is because they are like slanted rectangles and the area of a rectangle is that as well.

|


Homework:
Complete the classwork as part of your homework.

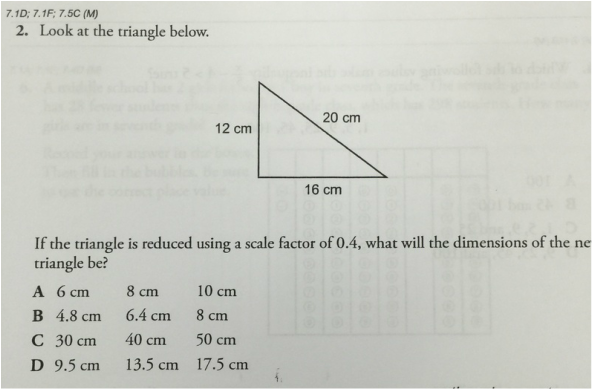
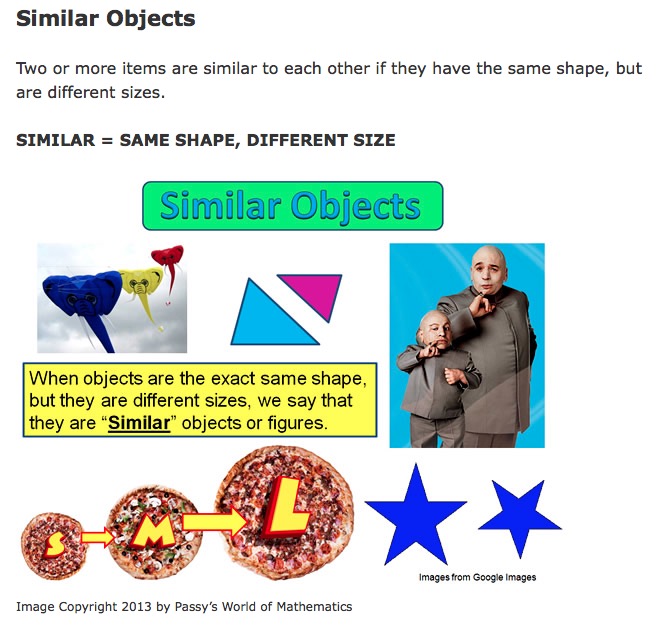
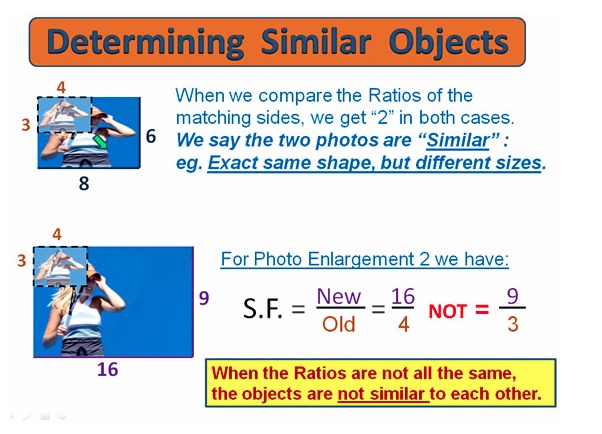
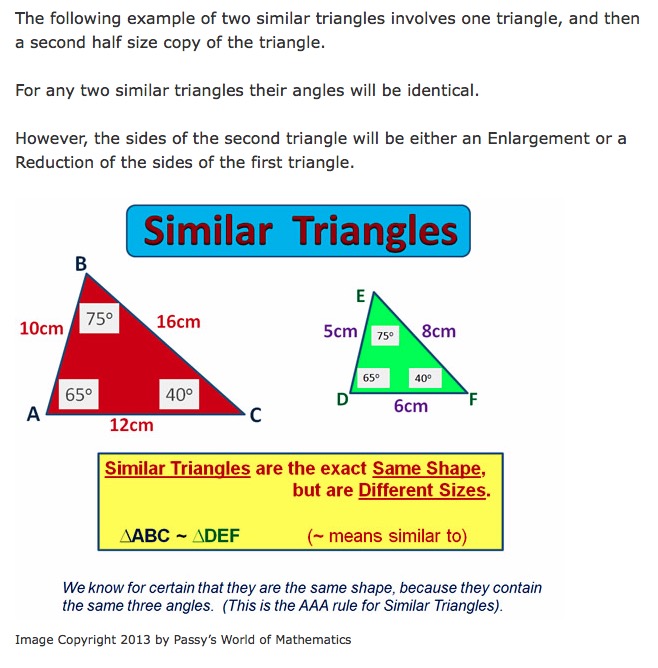
Similarity Notes to review:

Friday, March 20, 2015
Learning Goal (7.6F): We will be able to use the data from a random sample to make inferences about a population
Learning Goal (7.6G): We will be able to solve problems using data represented in bar graphs, dot plots, and circle graphs, including part-to-whole and part-to-part comparisons and equivalents
Learning Goal (7.12A): We will be able to compare two groups of numeric data using comparative dot plots or box plots by comparing their shapes, centers, and spreads
Learning Goal (7.12A): We will be able to compare two groups of numeric data using comparative dot plots or box plots by comparing their shapes, centers, and spreads
Learning Goal (7.12B): We will be able to use data from a random sample to make inferences about a population
Learning Goal (7.12C): We will be able to compare two populations based on data in random samples from these populations, including informal comparative inferences about differences between the two populations
Today's Announcements:
- Voluntary lunch tutoring is available Monday-Thursday on all days that I am here. Please take full advantage of this opportunity as it is a privilege and an extra resource.
- Please make sure you are taking out the following materials at the beginning of every class: Mock STAAR booklet, data desegregation sheet, ISN, pencil, math textbook.
- YOUR MATH STAAR TEST WILL BE APRIL 21, 2015.
- 19 instructional days until your math STAAR!
|
|
Classwork:
Activity: Please complete the following problems from pg.
Homework:
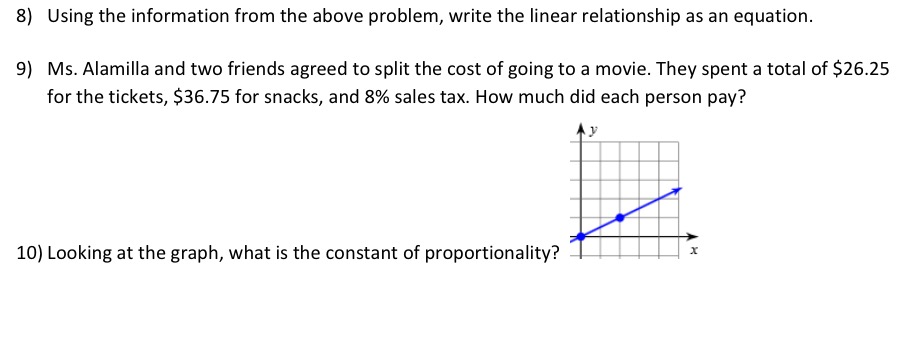
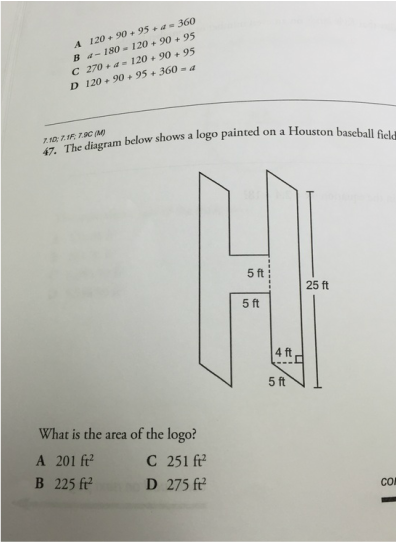
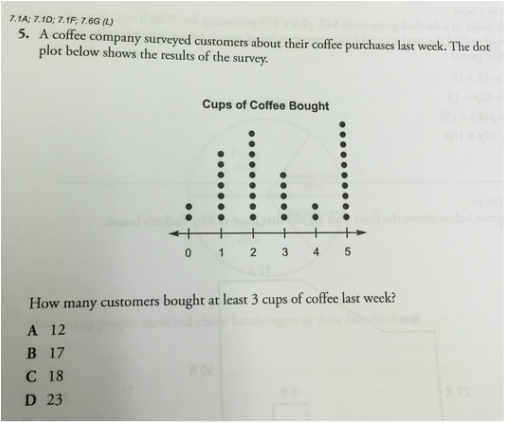
Please copy down the following Mock STAAR problems on your ISN. The notes provided by the videos will help you understand the problems better incase you got them wrong.
|
|

|
|
|
|
